
23rd Graph Drawing Contest
Contest Results
The 23rd Annual Graph Drawing Contest was held in conjunction with the 24th International Symposium on Graph Drawing and network Visualization (GD 2016).
The contest had two parts: the Creative Topics and the Live Challenge.
The creative topics were provided several months before the conference and focused on free-form visualization of specific graphs. Two graphs were provided, and participants were invited to submit any drawings of one or both of the graphs. The submissions were judged by the contest committee during the symposium. This year's topics were country relations in the Panama papers, and the Greek mythology family tree.
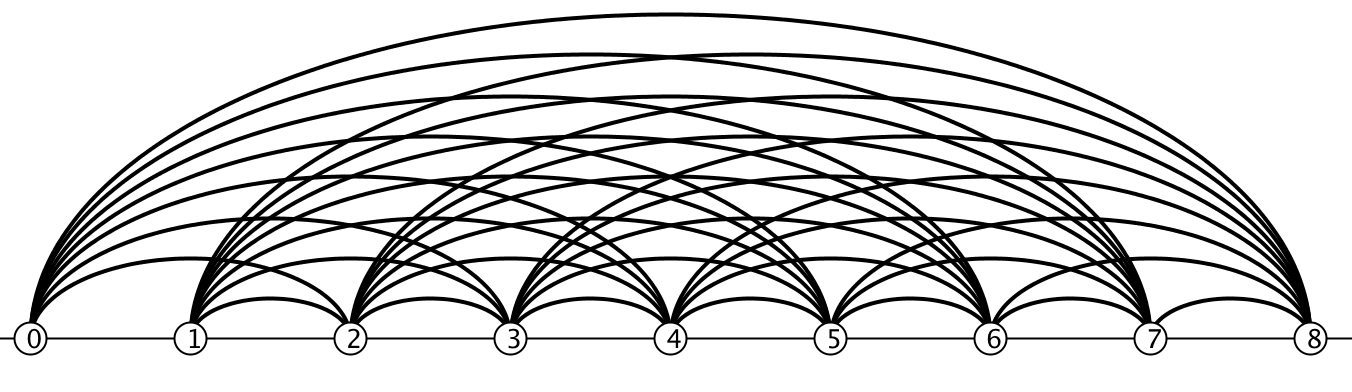
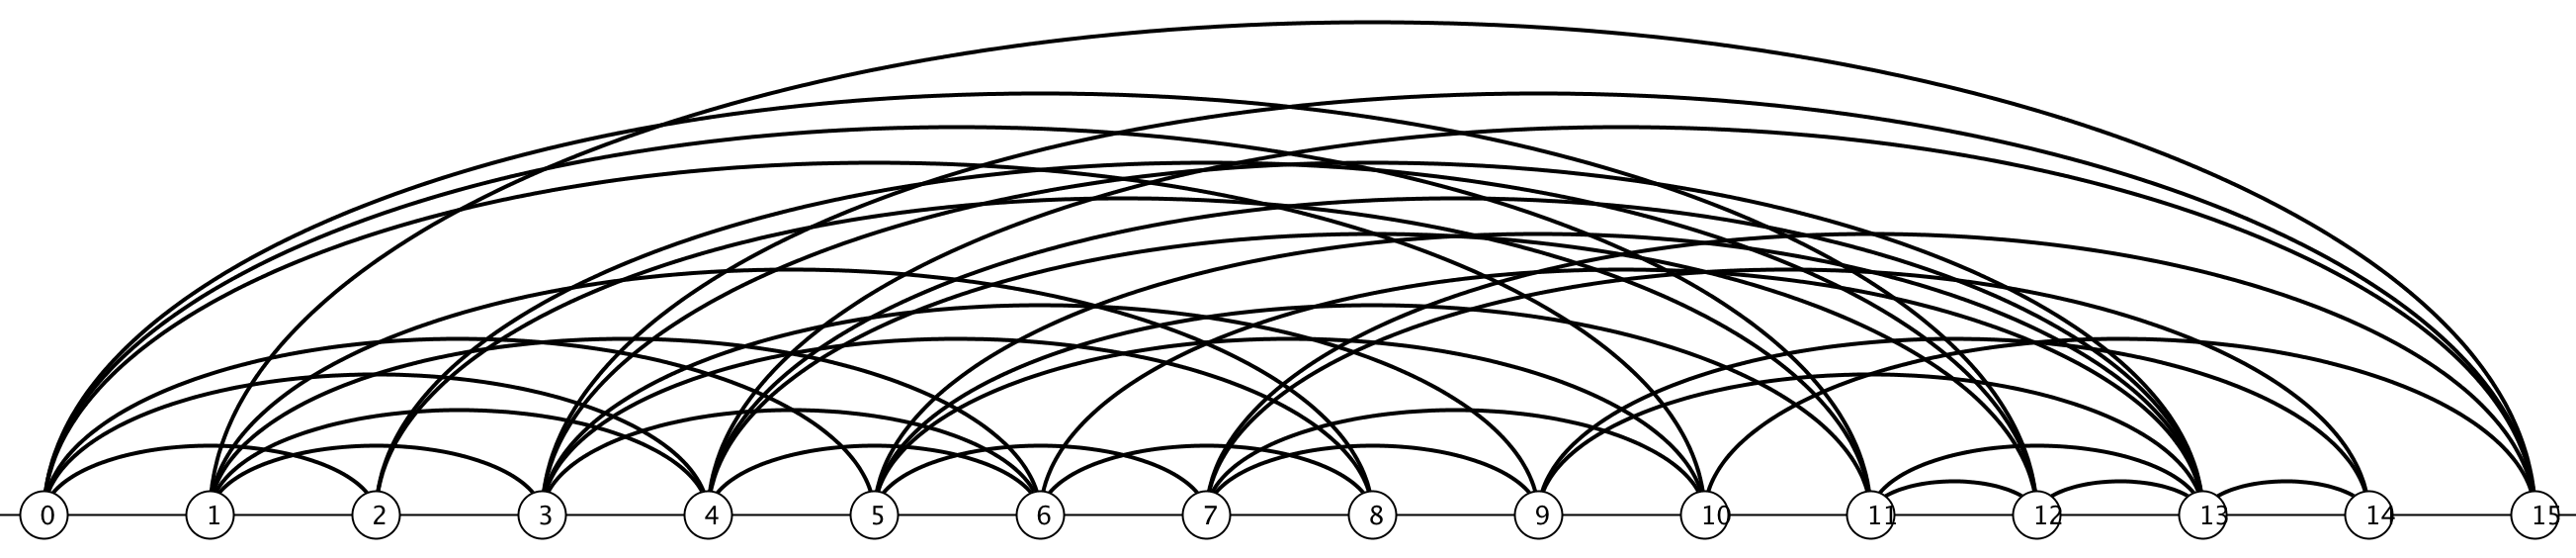
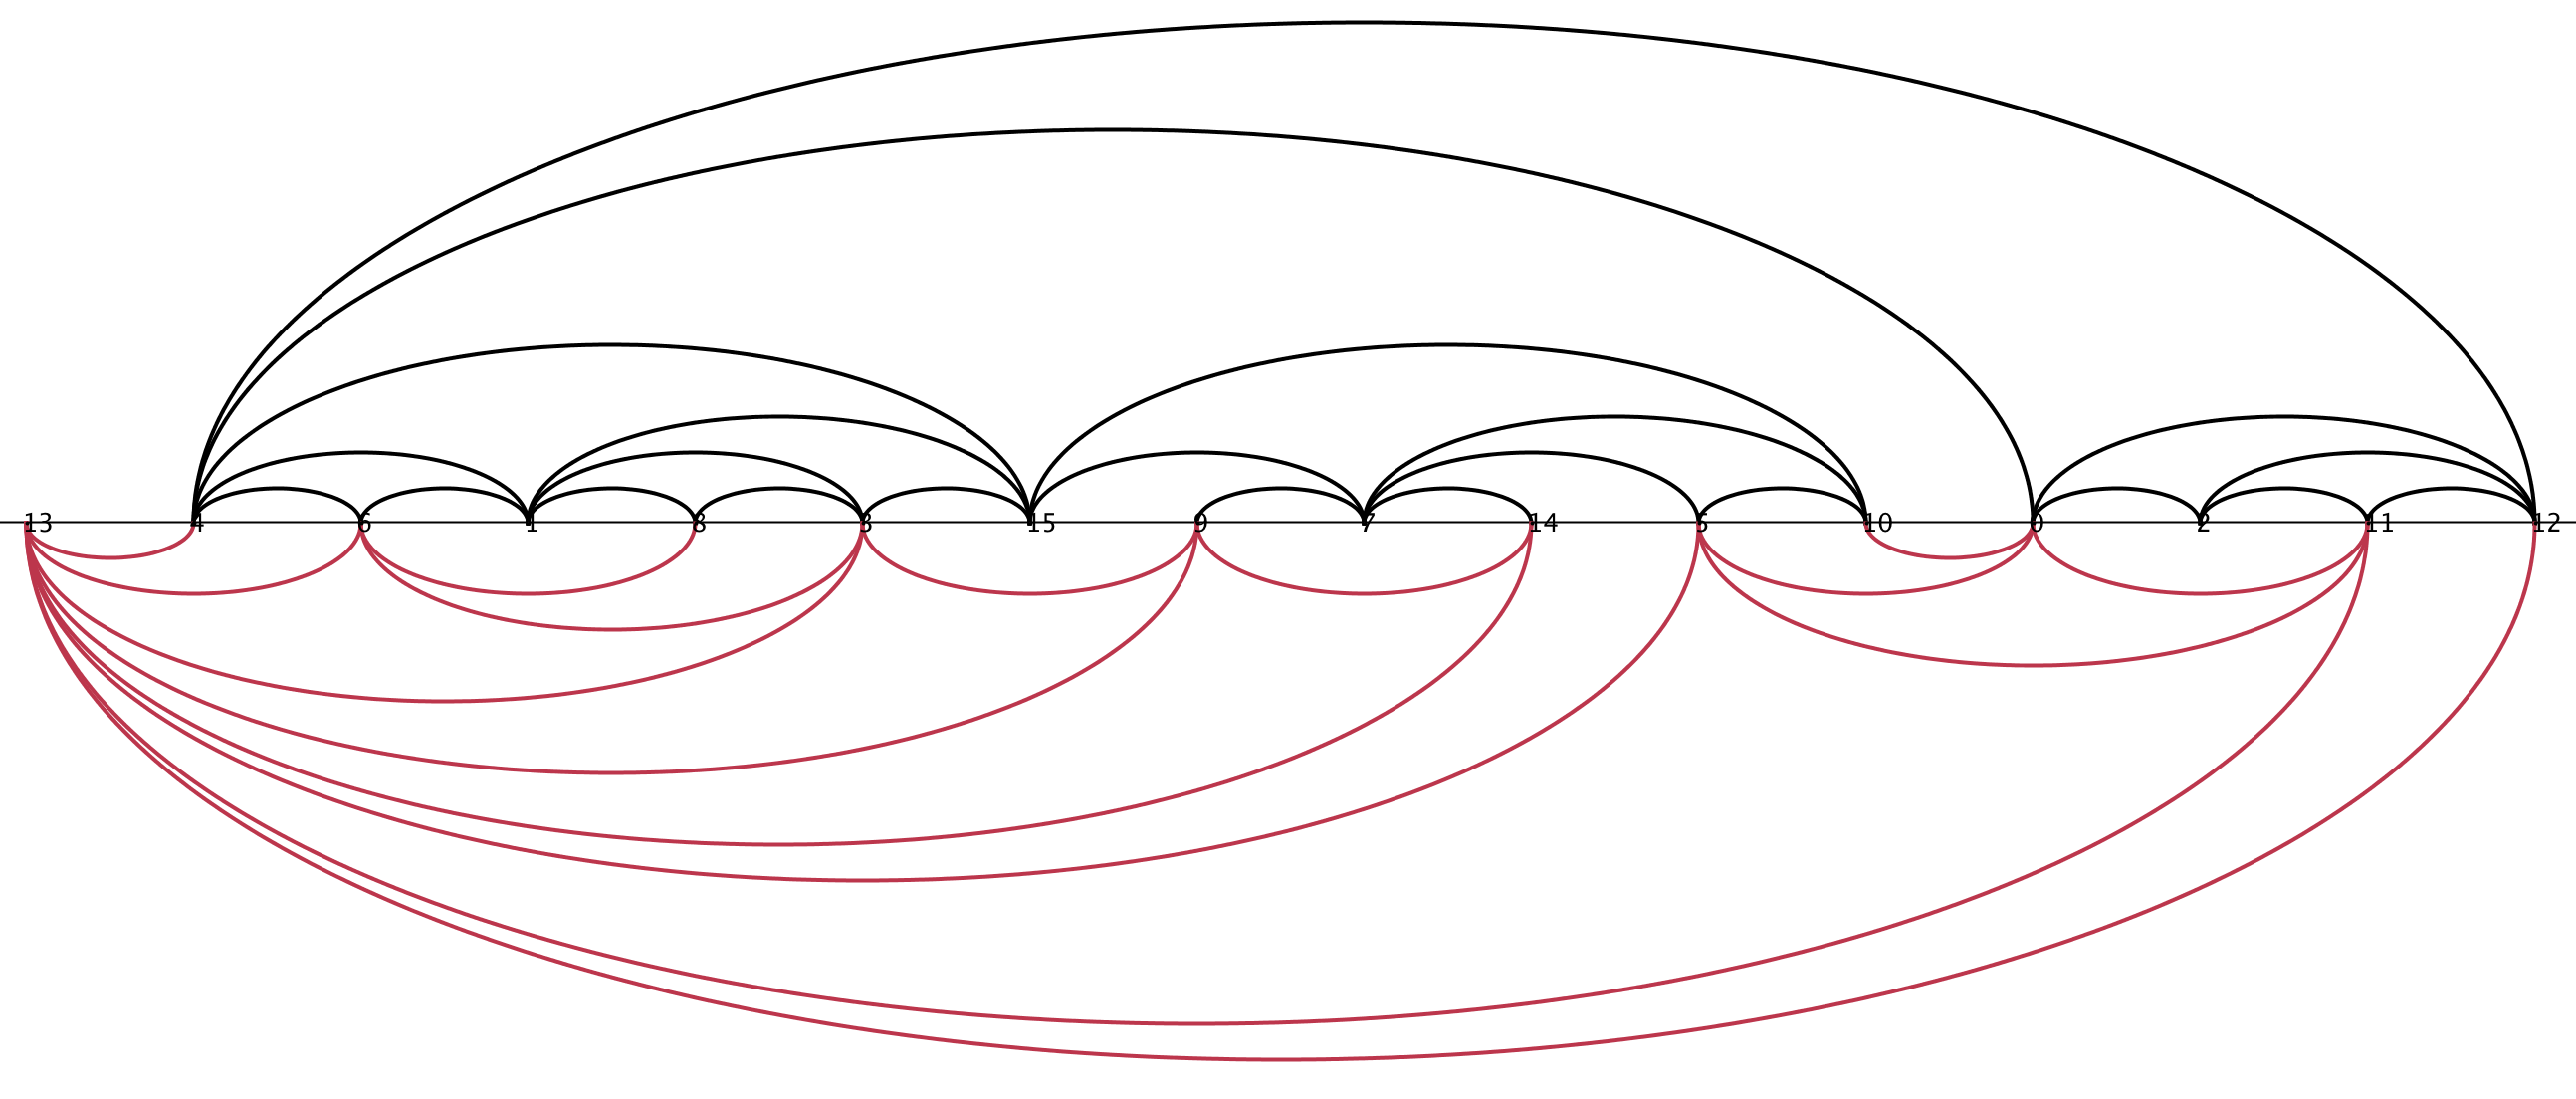
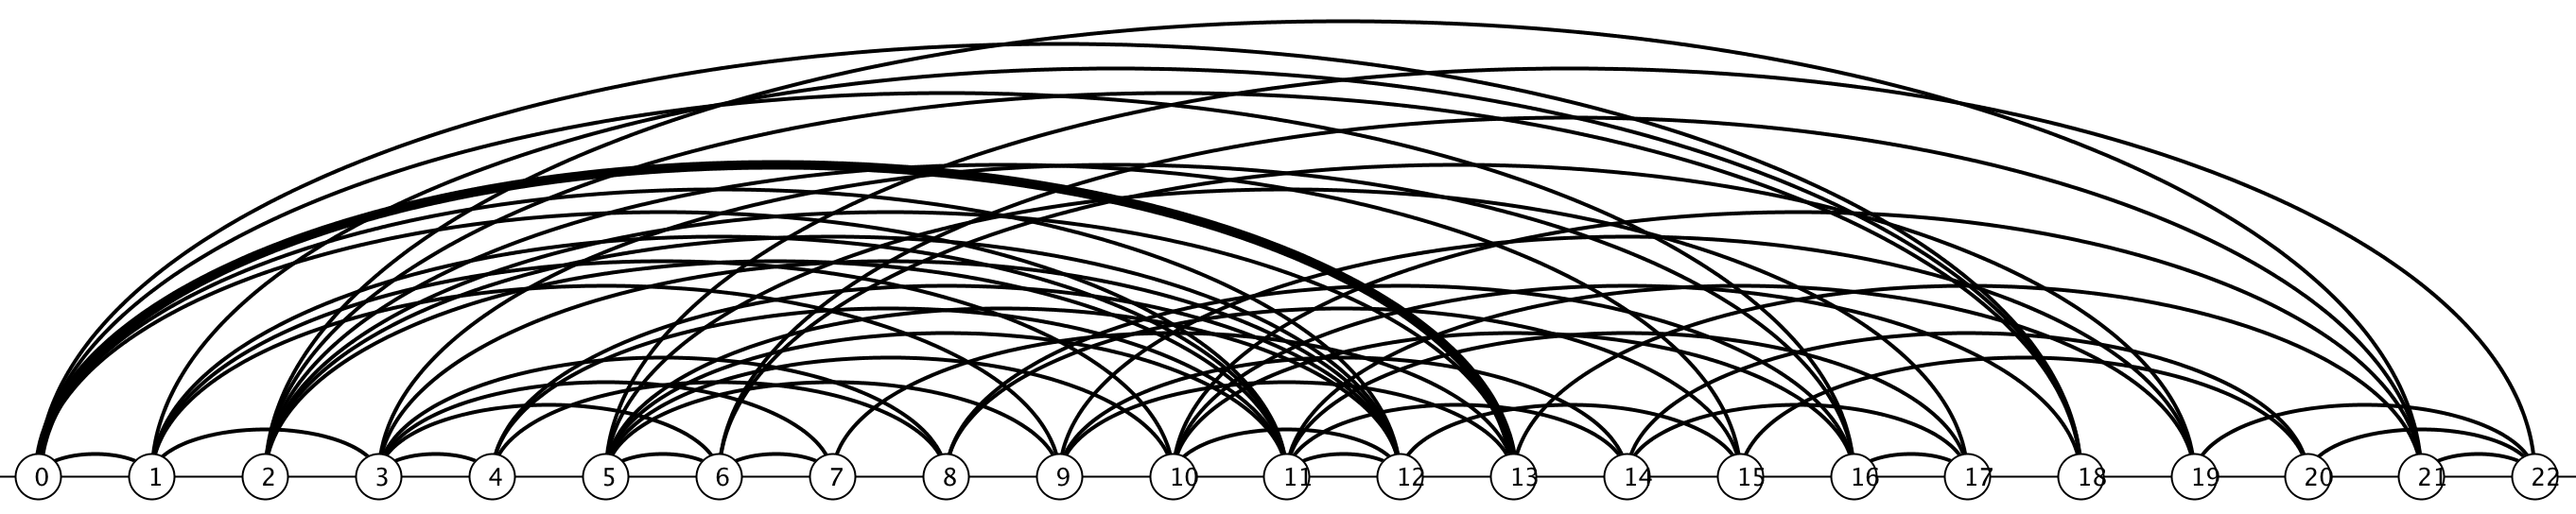
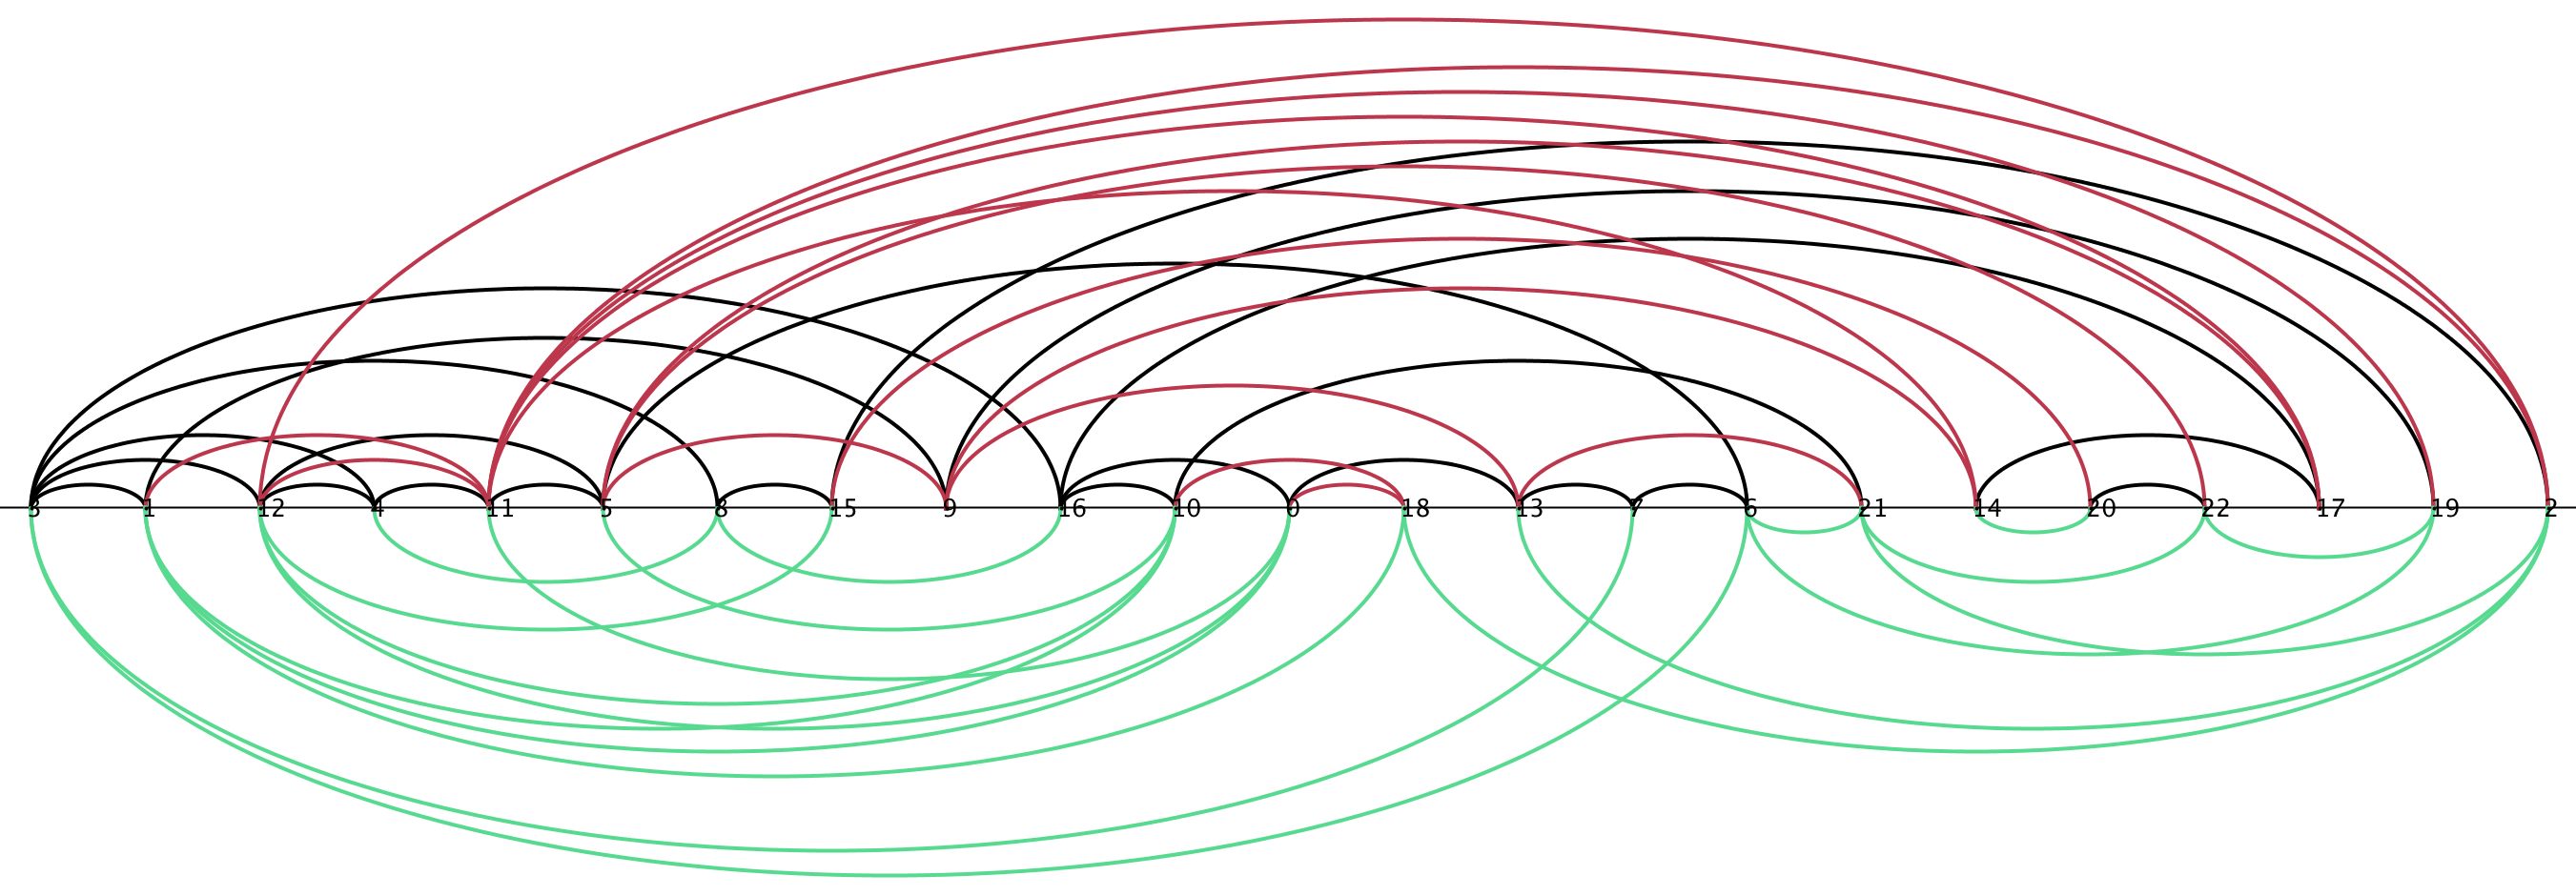
The live challenge was held during the conference in a format similar to a typical programming contest, where teams were presented with a collection of challenge graphs and had one hour to submit their highest scoring drawings. This year, the challenge focused on minimizing the crossing number in book embeddings. For details, see here.
Creative Topics: Panama Papers
We received two very nice submissions for this category.
Evmorfia Argyriou, Anne Eberle, and Martin Siebenhaller (yWorks)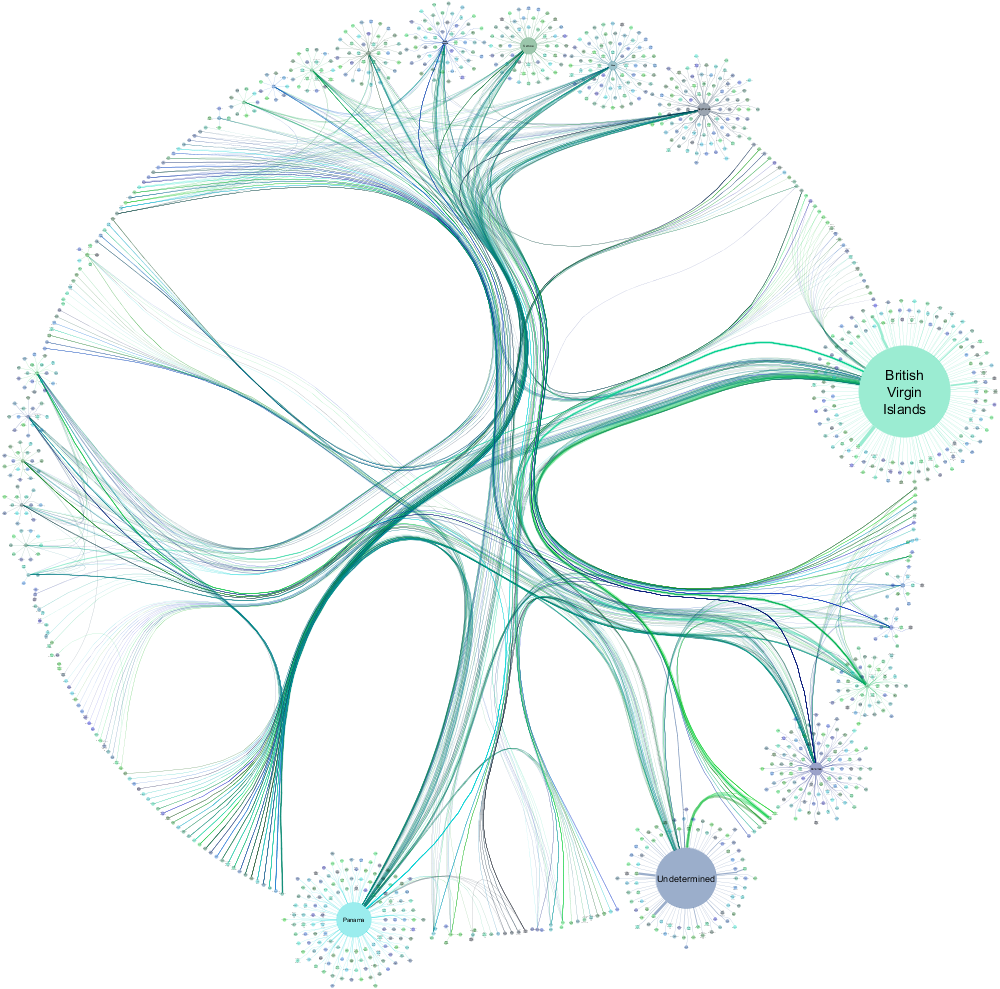
The committee likes the combination of clustering with radial layouts and organic edges, and a circular layout for the clusters that are connected with bundled edges. The representation of edge weights and (weighted) in-degrees via edge thickness and node sizes help a lot to grasp the underlying data.
Finally, we announce the winner of the 2016 Graph Drawing Contest, Creative Topics: Panama Papers:
Fabian Klute (TU Wien)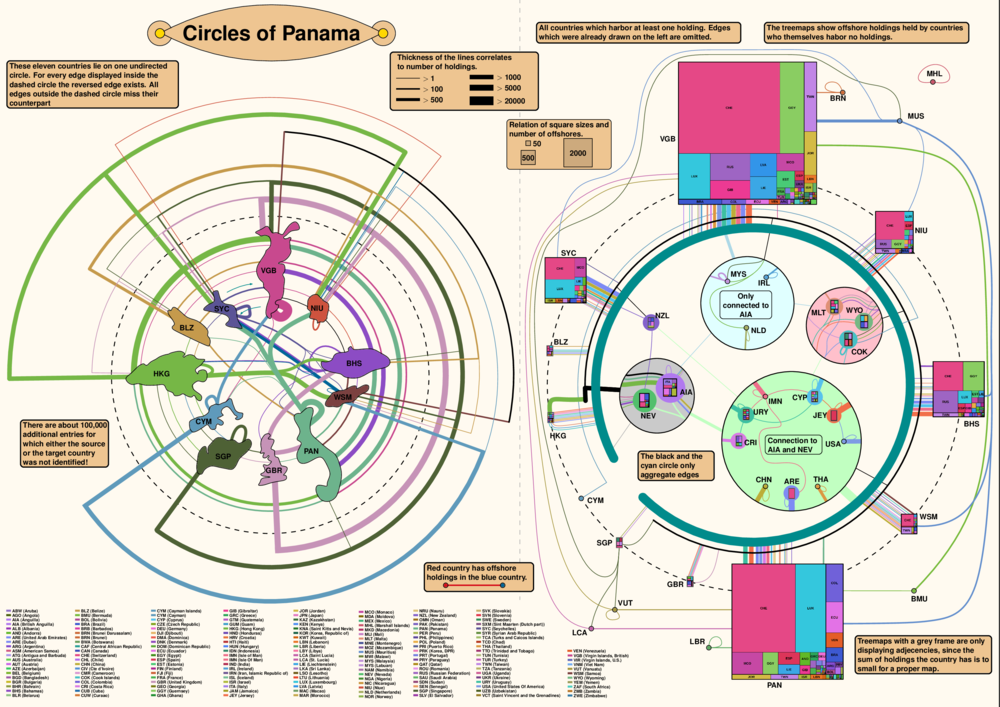
The committee likes the approach of this submission that derivates severely from standard approaches. The drawing is split into two parts. On the left, a highly connected subgraph consisting of eleven nodes is represented with different drawing styles depending on whether an edge exists in both directions or only in one. On the right, nodes without incoming edges are placed in treemaps that also represent vertices and are connected by various edge styles. The problem of label sizes was solved by using three-letter country codes and a different color for each country.
Creative Topics: Greek Mythology
We received four very nice submissions for this category. We will first list those that unfortunately did not make it to the top three.
Evmorfia Argyriou, Anne Eberle, and Martin Siebenhaller (yWorks)
|
Then, we present two runners-up. These drawings were selected for the top three and displayed on large poster boards at the symposium.
Thom Castermans, Tim Ophelders, and Willem Sonke (TU Eindhoven)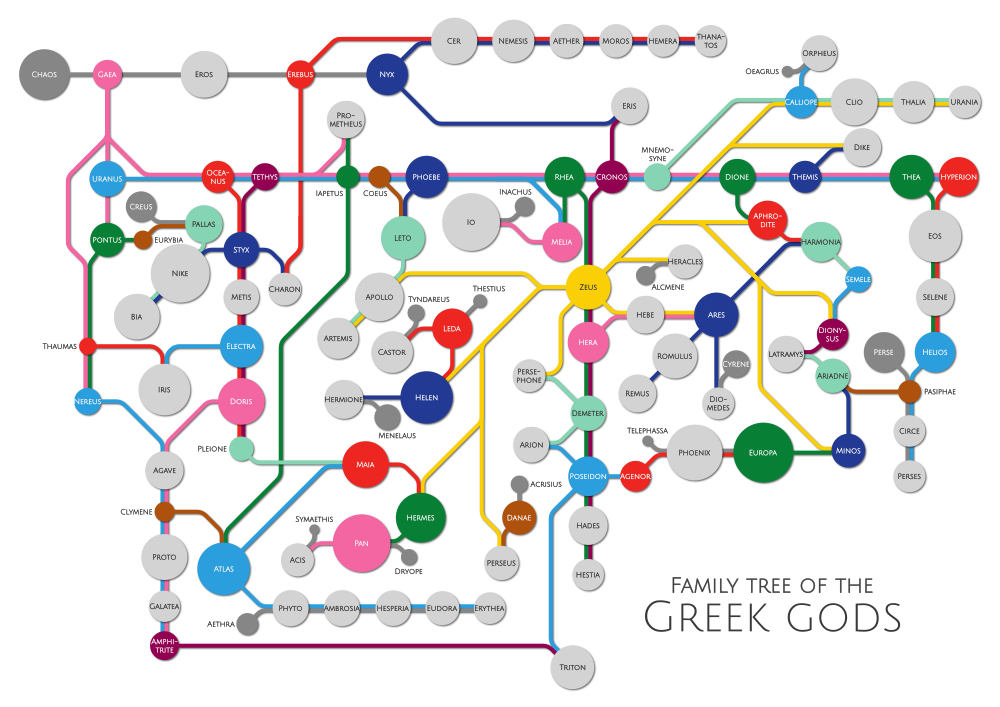
The first runner-up used a very interesting strategy to lay out siblings in order to reduce the complexity of the drawing: instead of drawing one edge from a parent to each of its children, a single (bundled) path is used that connects the children with the parent; in some cases (e.g., if there are too many children), more than one bundled path was used. The edges are colored by with the same color as the parent, which makes it easy to find the relationship between two nodes. The committee especially likes the metro map style of the drawing and the non-standard way of visualizing siblings.
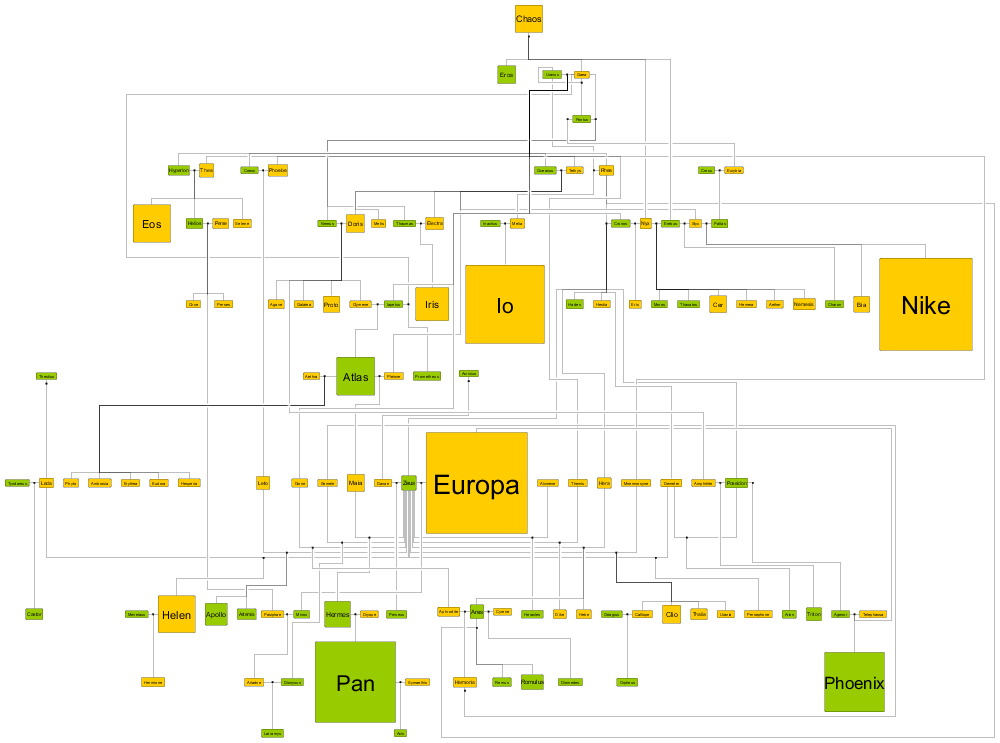
Mereke van Garderen (University Konstanz)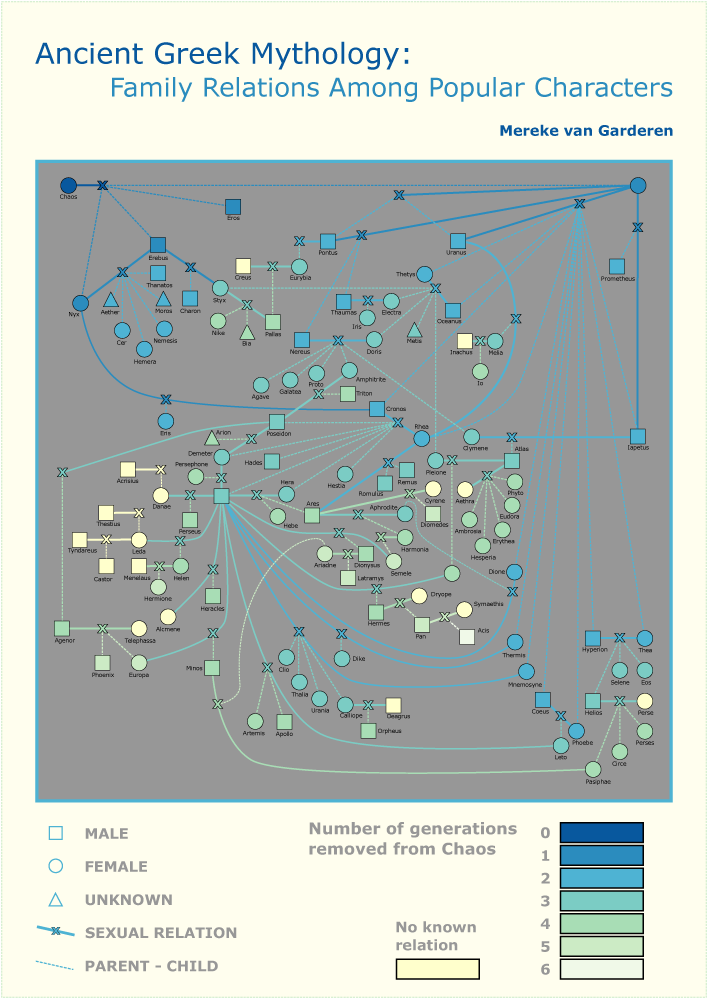
The second runner-up drew the graph completely manually without using existing algorithms. The vertices are nicely laid out and both keep the number of crossings small and keep immediate family members close together. The edges are drawn with a mix of straight lines (with few slopes) and splines. In order to still show the hierarchical layout of the graph, the nodes and edges are colored by their generation with respect to the goddess Chaos. The committee finds the visual appearance, the colors, and the edge styles very appealing.
Finally, we announce the winner of the 2016 Graph Drawing Contest, Creative Topics: Greek Mythology:
Jonathan Klawitter and Tamara Mchedlidze (Karlsruhe Institute of Technology)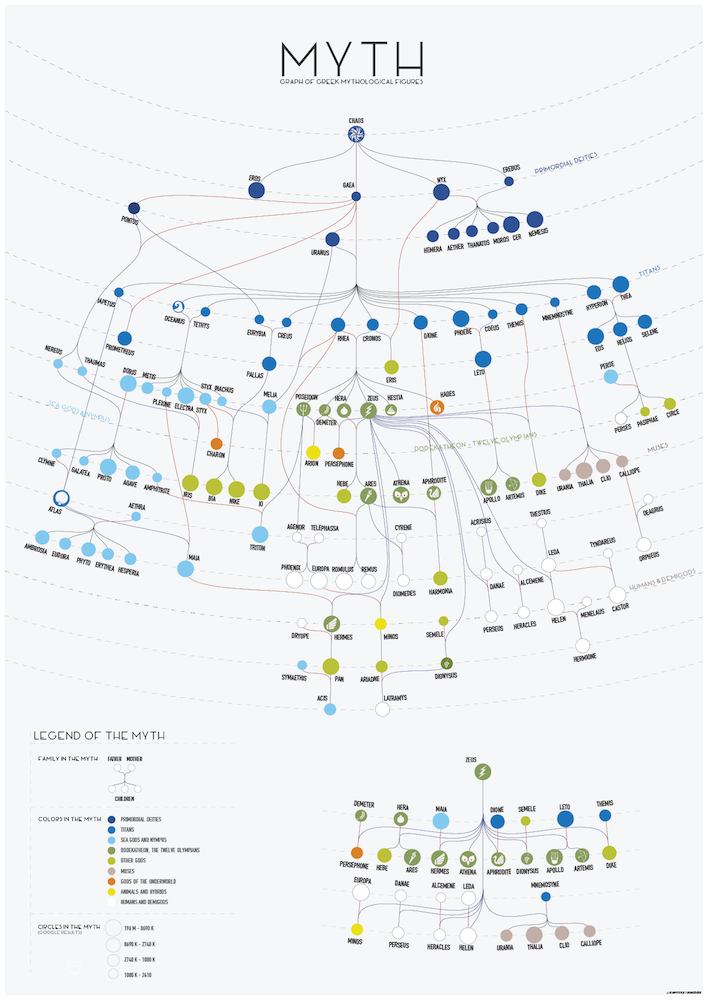
The committee was impressed by the aesthetic appeal of this submission. The layout is very nicely done and clearly shows the hierarchy in the family tree. The nodes are carefully placed on several circular arcs and the edges are drawn as curves; in order to represent families, the father--children and the mother--children edges form bundles. The committee especially liked the coloring of the vertices that represent different types of entities in the Greek myth, such as titans, sea gods, or muses. Similar types are grouped closely together. For the twelve Olympian gods (and some other very important figures), the authors also added their symbols inside the nodes. Below the drawing of the whole graph, there is a second drawing that only shows the partners and children of Zeus.
Live Challenge: Manual Category
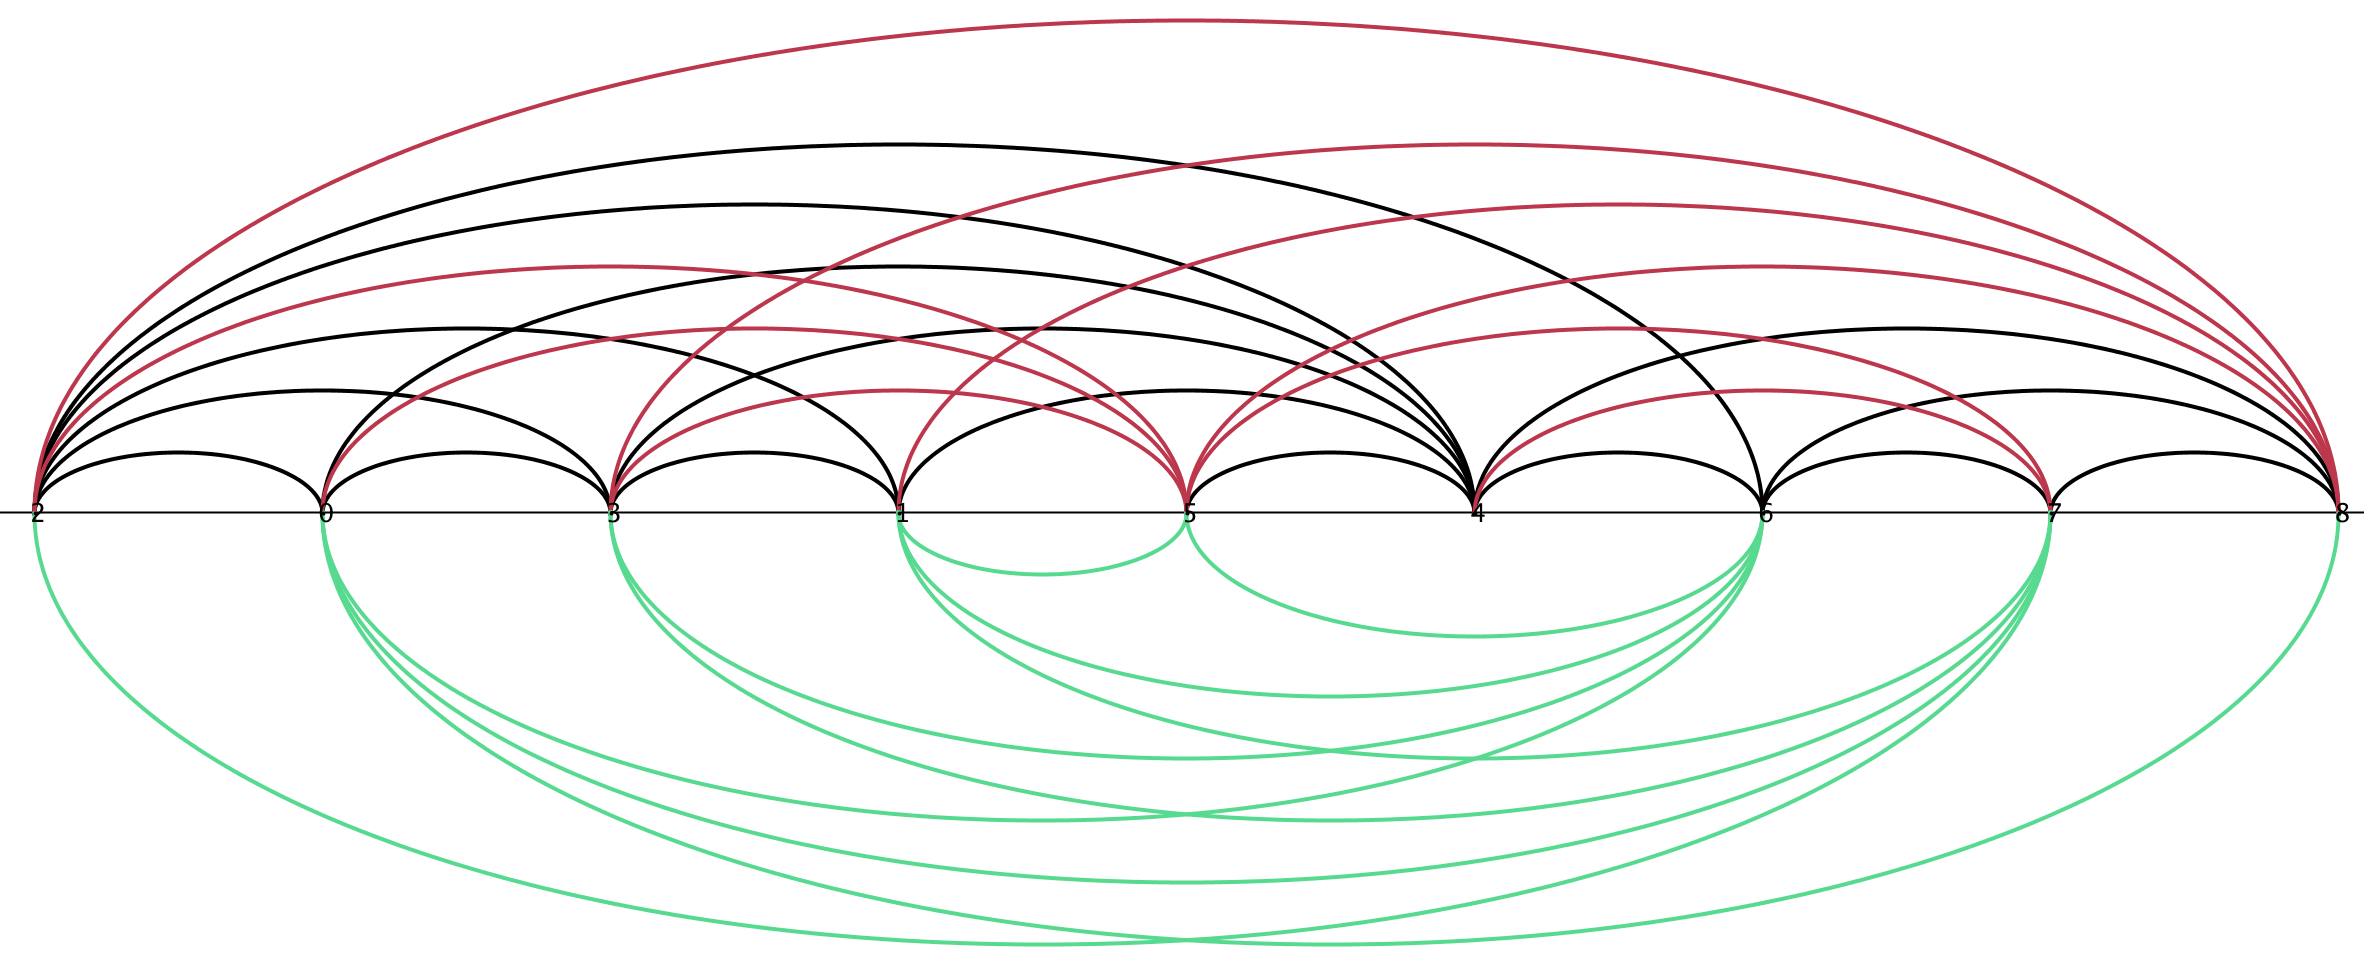
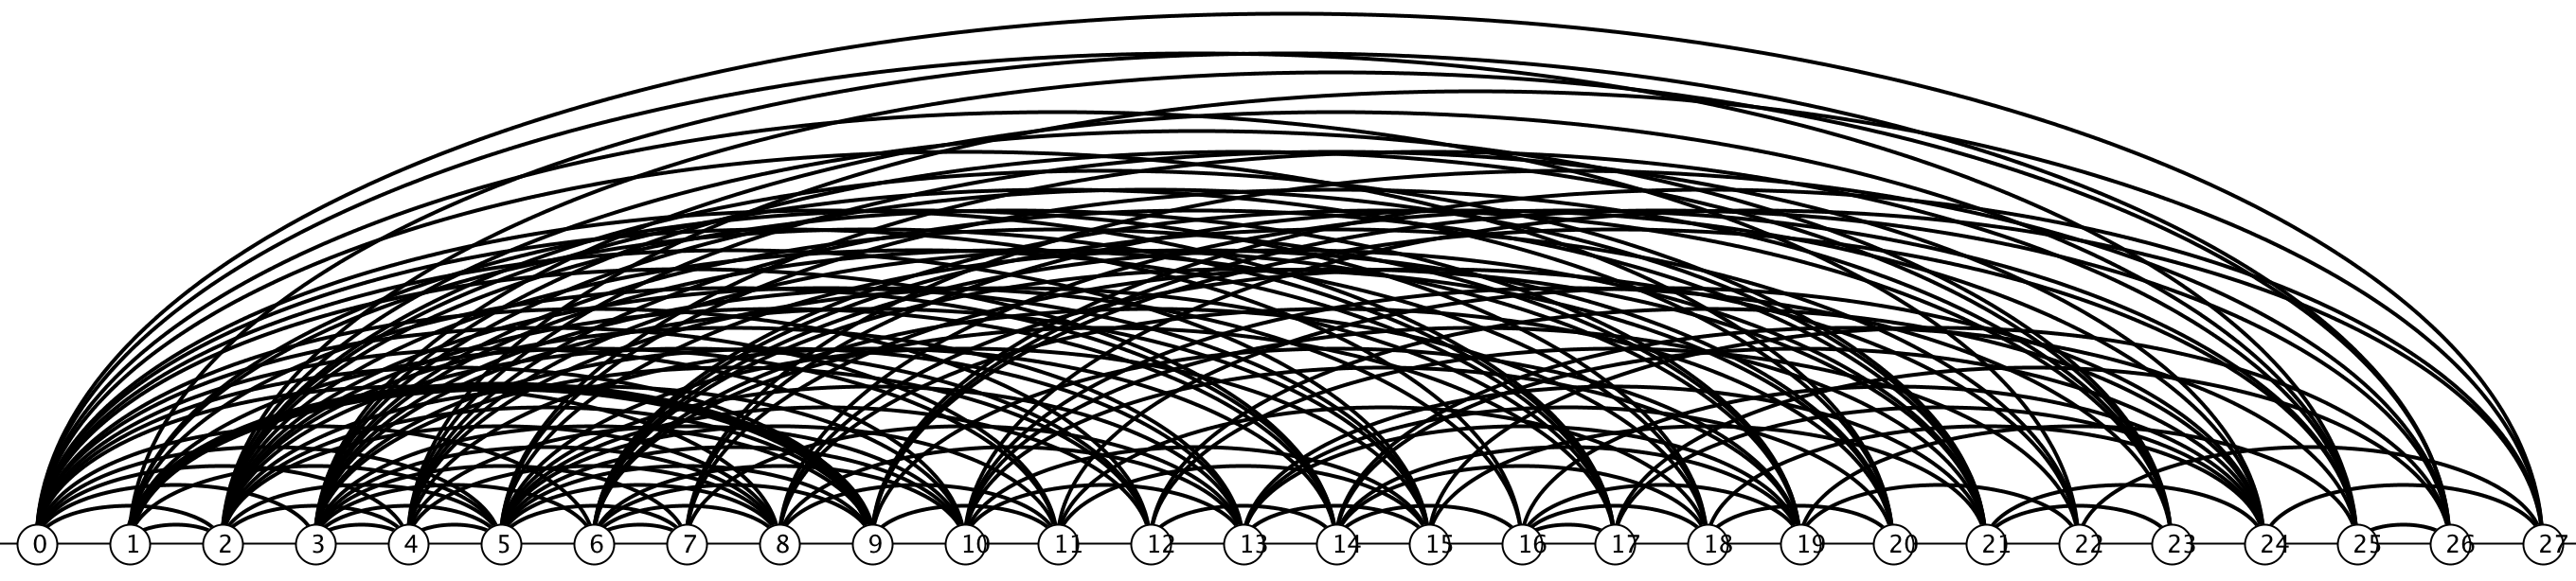
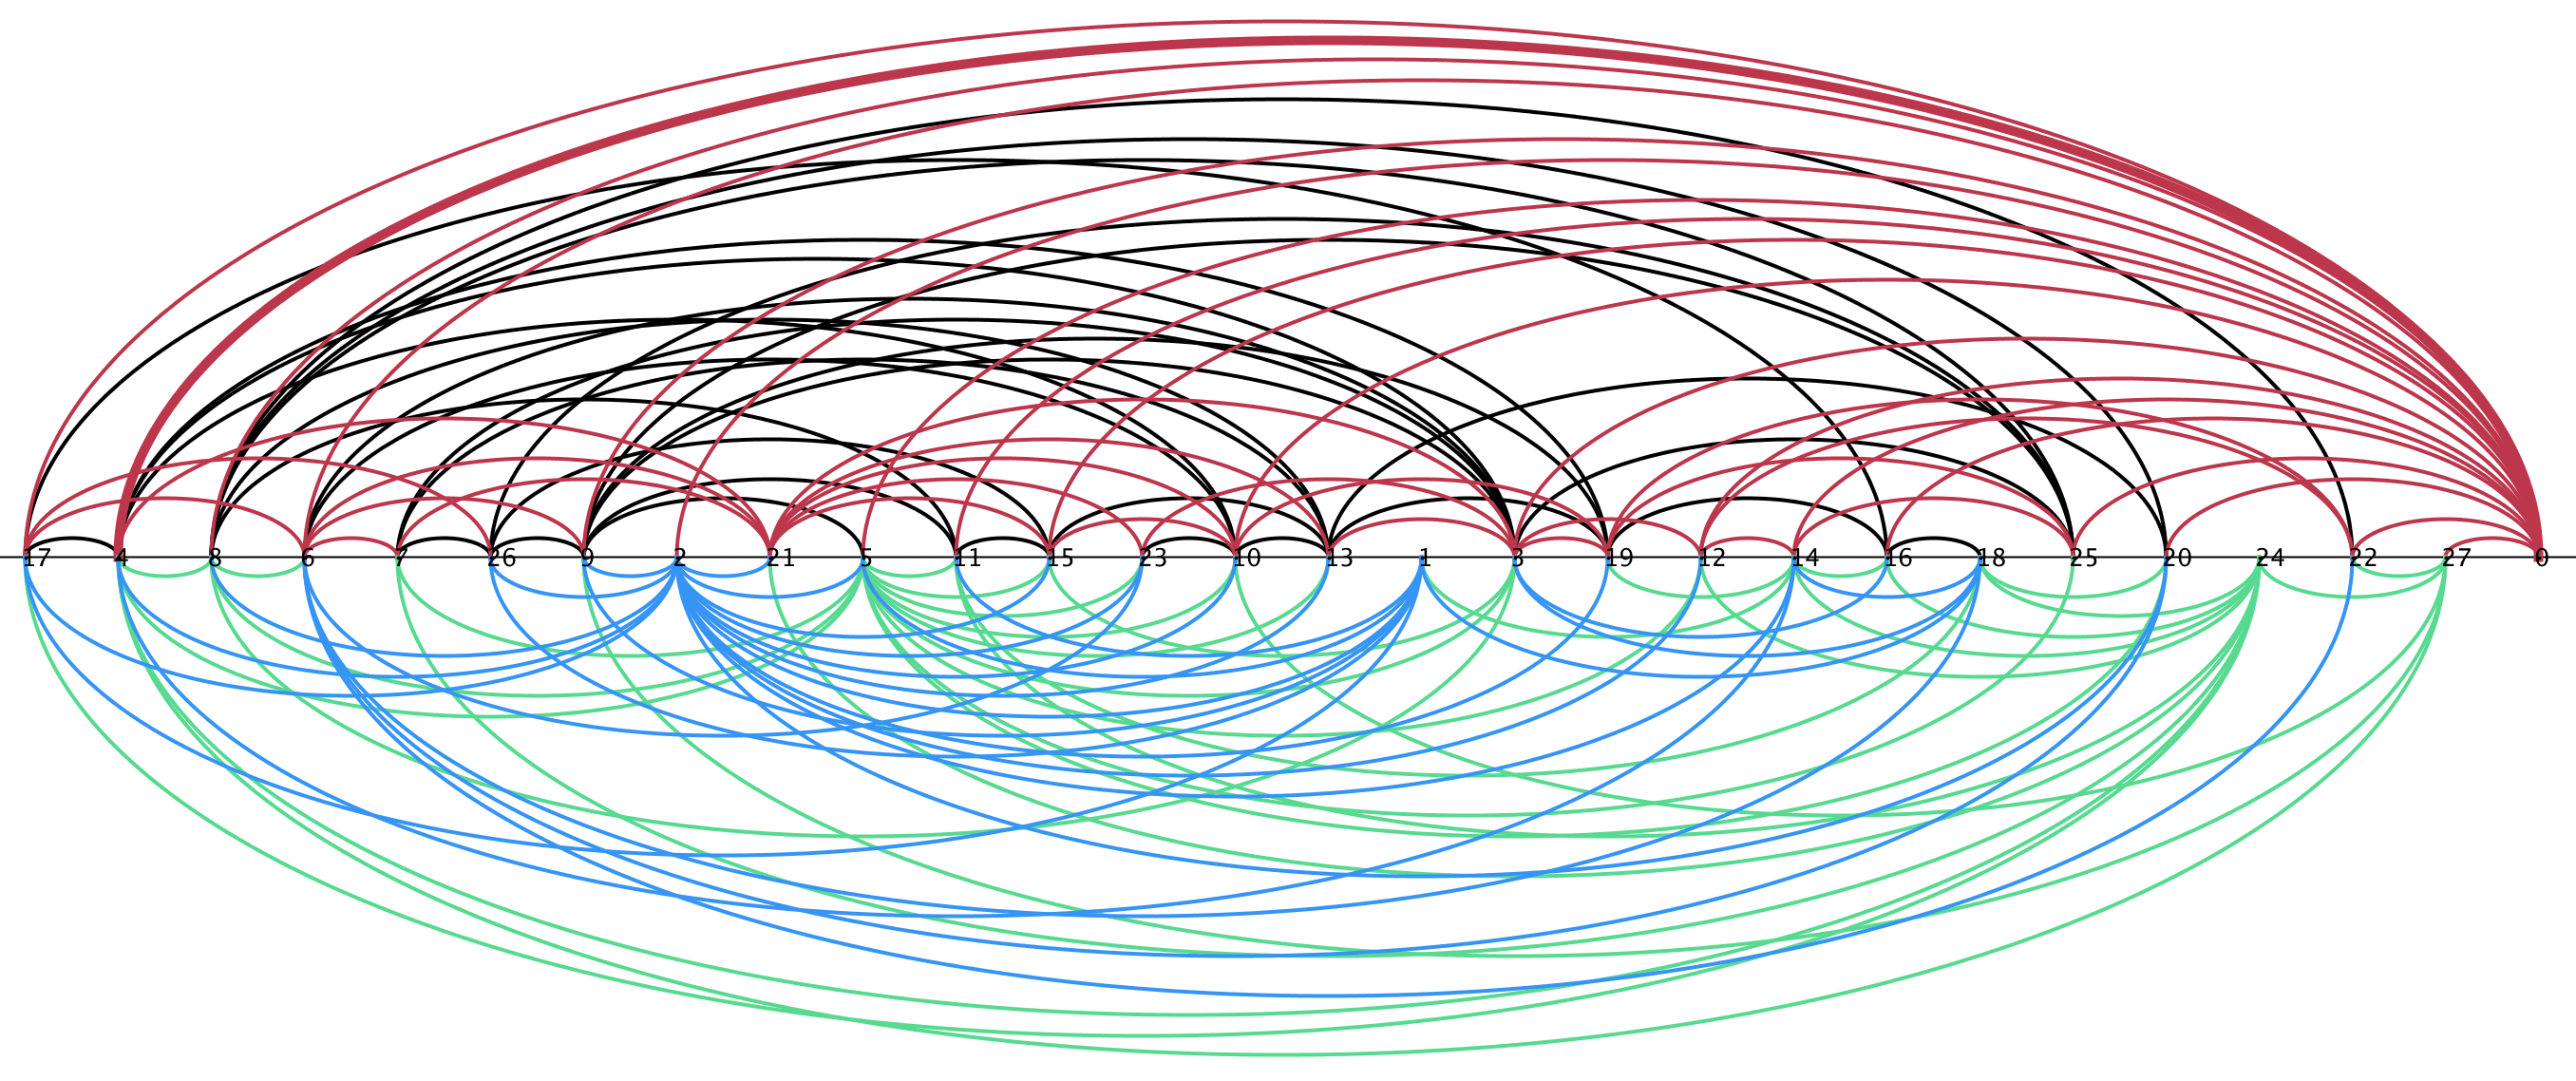
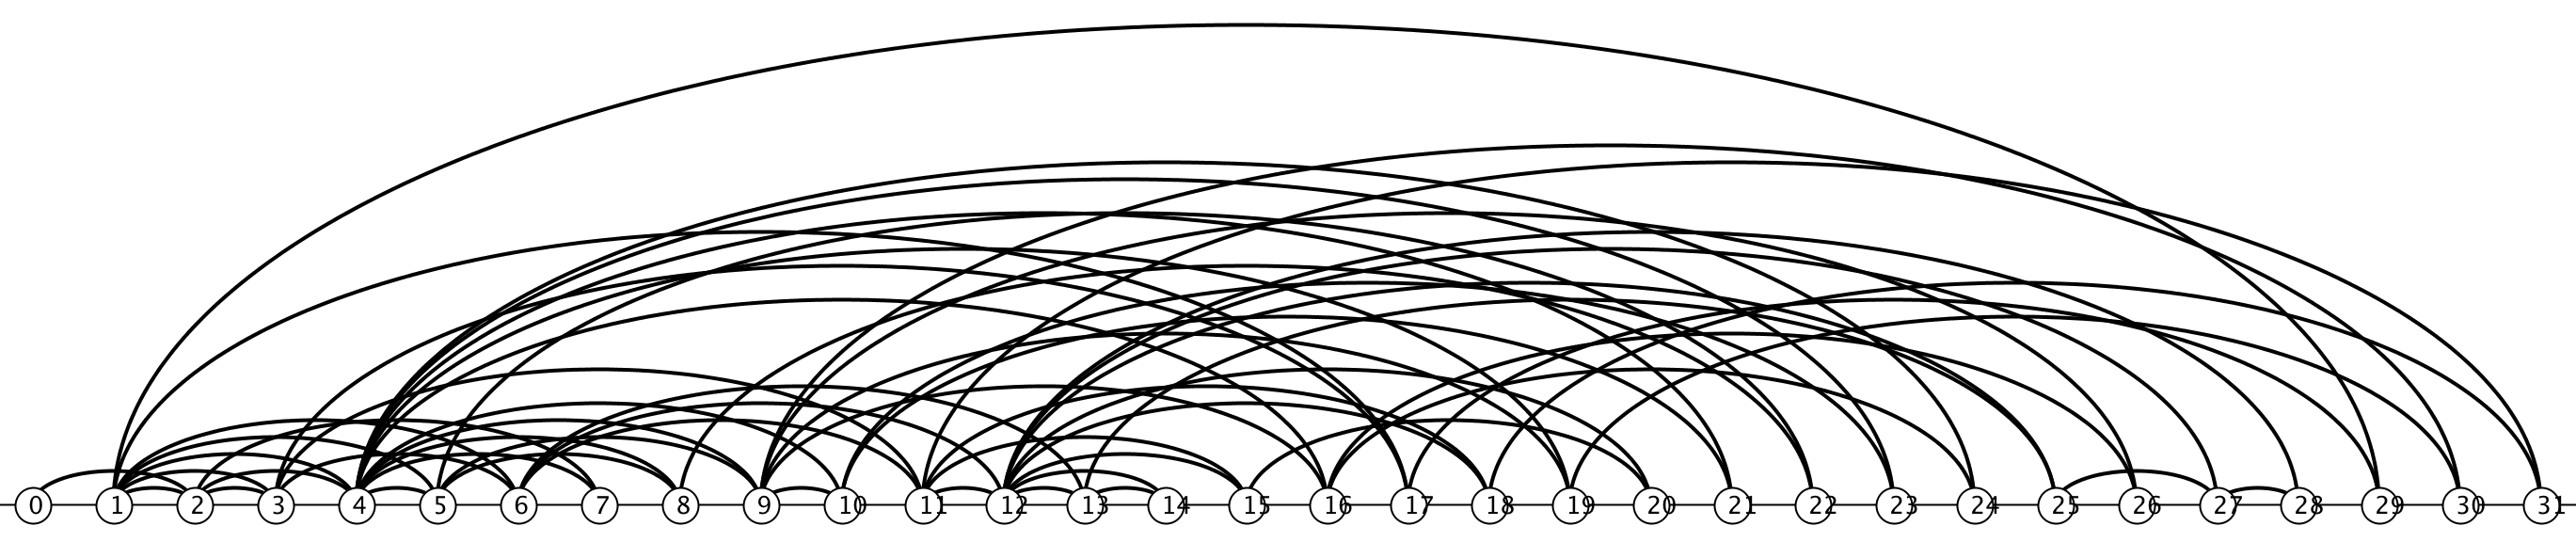
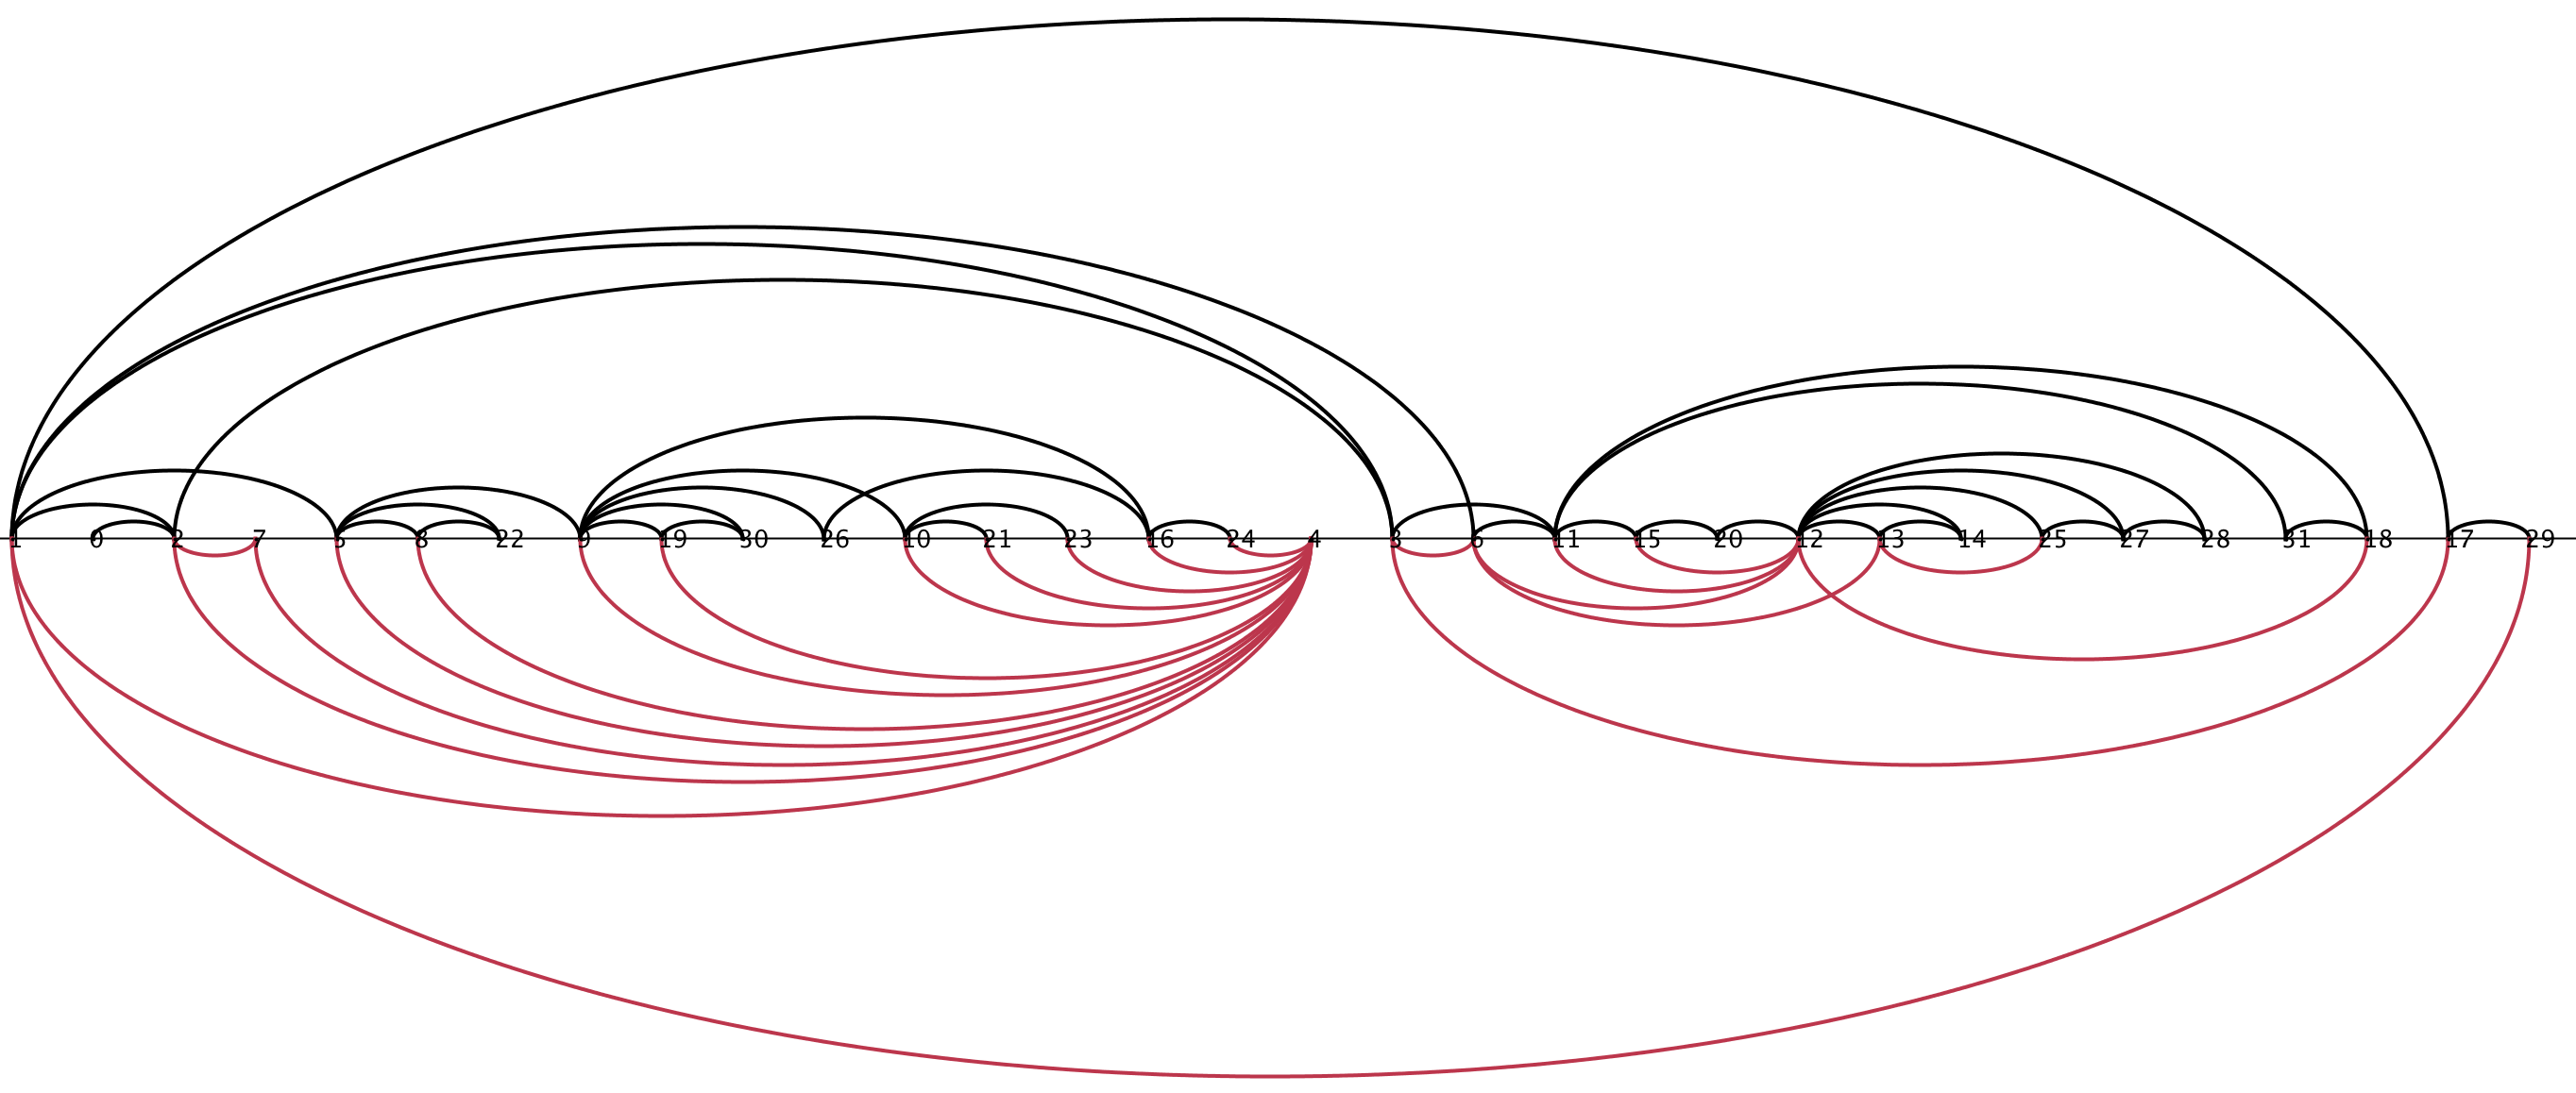
In the manual category, participants were presented with five graphs. We present the input layouts and the best manual submitted solutions.
|
|
|
|
|
|
|
|
|
|
We are happy to present the full list of scores for all teams. The numbers listed are the number of crossings in each graph; the horizontal bars visualize the corresponding scores.
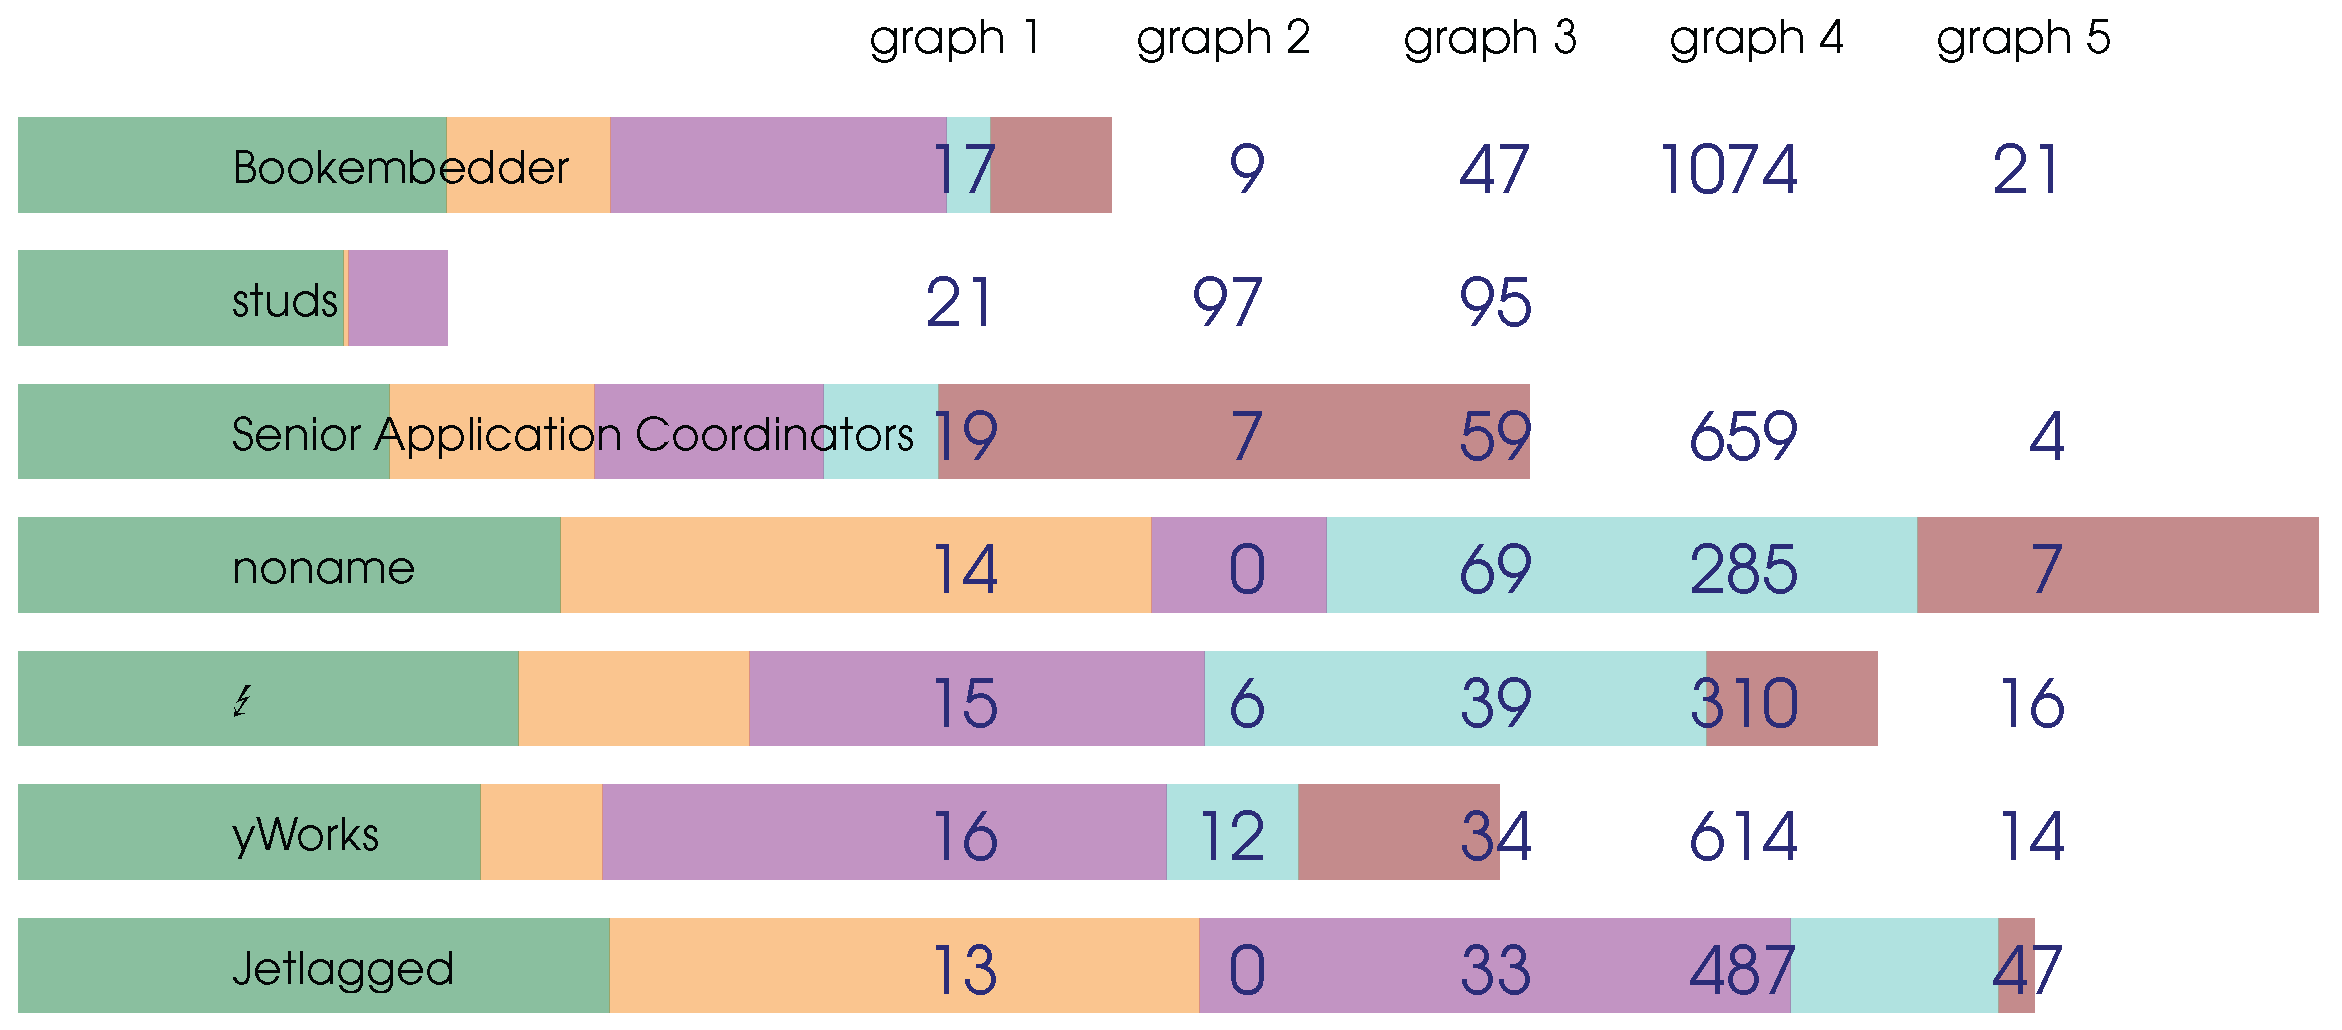
The winning team is team noname, consisting of Michael Bekos, Thanasis Lianeas, and Chrysanthi Raftopoulou!
Live Challenge: Automatic Category
In the automatic category, the same five graphs as in the manual category had to be solved, and in addition another set of five much larger graphs. The larger graphs are too large to visualize, so we present only a table of the best solutions.
Again, we are happy to present the full list of scores for all teams. The numbers listed are the number of crossings in each graph; the horizontal bars visualize the corresponding scores.
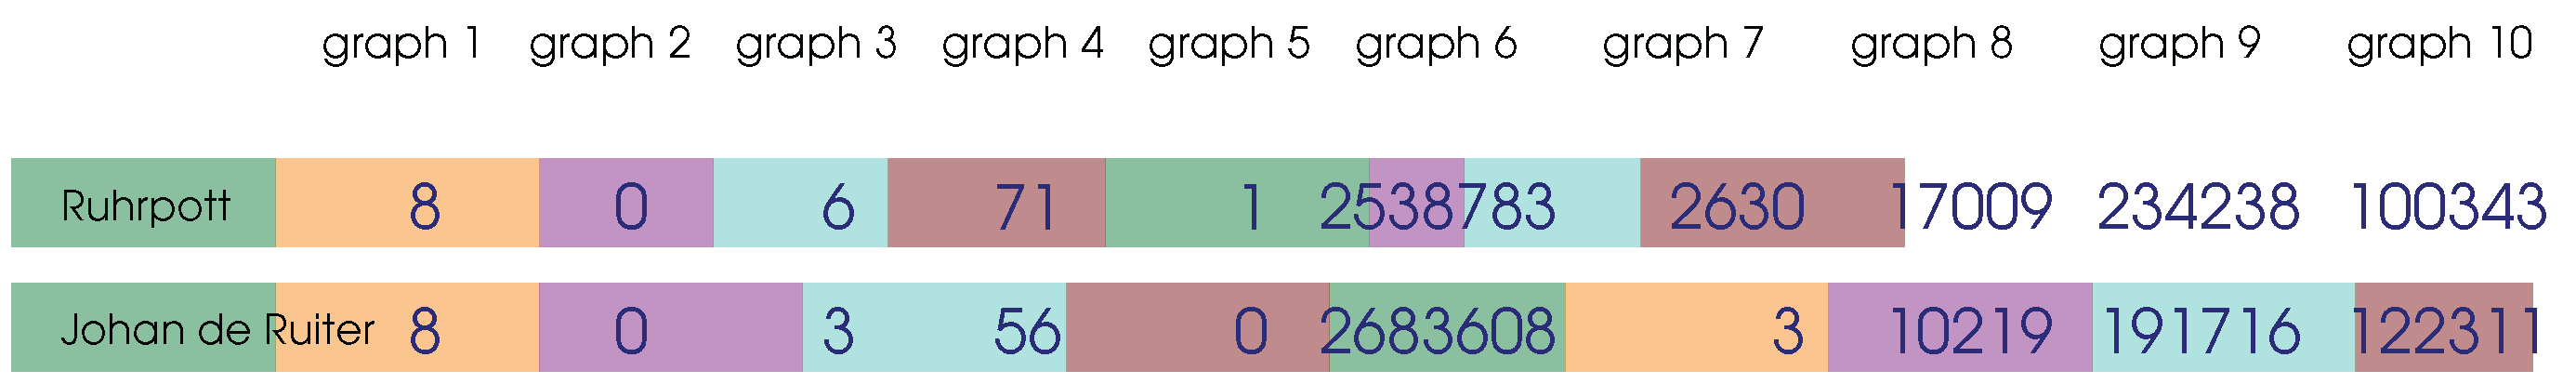
The winning team is team team Johan de Ruiter, consisting of Johan de Ruiter!